What each number on a GLP-1 lab report means, what a good result looks like, and what a result can't tell you.
Last reviewed 16 Nov 2026
What each test does, and doesn't
A lab report is only as useful as the tests behind it. No single test answers every question, so check which ones were run before reading the numbers.
LC-MS
Liquid chromatography–mass spectrometry
Separates the sample on a column, then turns the molecules into charged particles and weighs them. Software converts the readings into the molecule's mass.
Tells you
Whether the expected molecule is present (identity)
Whether a different peptide is there instead, by its mass
The masses of some impurities
Doesn't tell you
How much of the peptide there is, unless the lab runs a separate quantitative method
That the peptide is the main thing in the vial: a small amount of the right molecule still reads "identity confirmed"
Anything that doesn't ionise well, such as salts and many fillers
Molecules with exactly the same mass, such as some altered forms of the peptide
Bacteria, endotoxin or sterility
On the report: "Identity confirmed" plus the mass found, in daltons (Da)
HPLC
High-performance liquid chromatography, usually with a UV detector
Pumps the sample through a column that holds back each component for a different time. A UV detector draws each component as a peak as it comes out.
Tells you
Purity: the main peak's share of all peaks
Quantity in milligrams, when compared with a reference standard of known amount
Identity, but only weakly: a peak at the same time as a reference standard
Doesn't tell you
Proof of identity on its own: two different peptides can come out at the same time
What the impurity peaks actually are
Water, salts and other things that don't absorb UV light
Bacteria, endotoxin or sterility
On the report: Purity in %, quantity in mg, and a chromatogram
Mixes the sample with a reagent made from horseshoe crab blood, which clots or changes colour when bacterial endotoxin is present. The strength of the reaction gives the amount.
Tells you
How much endotoxin is present: the toxin from the cell walls of certain bacteria, which can cause fever and shock when injected
Doesn't tell you
Whether live bacteria or fungi are present
Toxins and other fever-causing substances that aren't endotoxin
Identity, purity or quantity
A reliable value if the sample interferes with the reagent; good labs check for this
On the report: Endotoxin units (EU) per mg or per vial, often "< x" when below the detection limit
Sterility test
Culture or rapid PCR
A culture test puts part of the sample in growth media for about 14 days and watches for growth. A rapid test uses PCR to look for bacterial DNA.
Tells you
Whether microorganisms were found in the portion tested
Doesn't tell you
That every vial in the batch is sterile: only part of a sample is tested
Endotoxin: a sterile sample can still contain toxin from bacteria killed earlier
With PCR: whether the bacteria found were alive, or organisms the test isn't designed to detect
On the report: Pass or fail ("no growth", "not detected")
Which test answers which question
Test
Right molecule?
How pure?
How much?
Endotoxin?
Sterile?
LC-MS
Yes
Partly
Partly
No
No
HPLC
Partly
Yes
Yes
No
No
LAL test
No
No
No
Yes
No
Sterility test
No
No
No
No
Yes
"Partly" for LC-MS: some labs can estimate purity or amount by LC-MS, but most report it for identity only. "Partly" for HPLC identity: a matching retention time supports identity but doesn't prove it. A full picture of an injectable needs LC-MS and HPLC, plus endotoxin and sterility if you want to know it is safe to inject.
Identity: is it the right molecule?
Identity is usually tested with LC-MS, which weighs the molecule. The report gives the mass found, often after the software combines several charged forms of the peptide into one value. Compare it with the expected mass below. A small difference, around 1 to 2 daltons, can come from the instrument or the calculation used. A large difference means a different molecule.
Illustration built from tirzepatide's calculated masses, not a real measurement. Real spectra show each ion as a small cluster of isotope peaks and some background noise. A real report may show any of these three views; the deconvoluted mass is the one to compare with the table above.
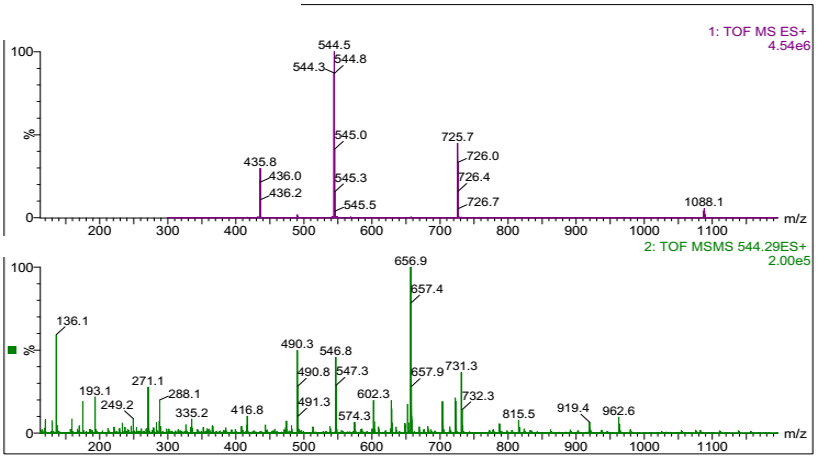
A real spectrum from lab
Real data from an LC-MS (ESI-TOF), sample details removed. This peptide is not a GLP-1: it weighs about 2174 Da. The reading method is the same for any peptide.
Top panel: full mass spectrum
One molecule appears as several peaks because it picks up different numbers of charges: 1088.1 (2+), 725.7 (3+), 544.5 (4+) and 435.8 (5+).
The small peaks next to each main peak are isotopes. Their spacing gives the charge: 544.3, 544.5, 544.8 are 0.25 apart, so that ion carries 4 charges.
Mass = (544.5 − 1.007) × 4 ≈ 2174 Da. Every charge state gives the same answer, which is a good sign that it is one molecule.
Bottom panel: MS/MS fragmentation
The 4+ ion was isolated and broken apart. The fragments form a fingerprint of the peptide's amino-acid sequence.
This goes further than mass alone: it can tell apart two molecules with the same weight. Most consumer lab reports show only the top panel or the deconvoluted mass.
HPLC can also suggest identity by comparing retention time with a reference standard, but two different peptides can come out at similar times. LC-MS is the stronger proof.
Purity: how much of it is the peptide?
HPLC separates the sample into its components and draws each as a peak. Purity is the main peak's share of all the peaks, as a percentage. Many sellers claim 98% or more.
Illustration, not a real result. A clean sample shows one dominant peak; every extra peak is something else in the vial.
Purity counts only what the detector sees. Water, salts and counter-ions such as acetate or TFA don't show up, so a 99% pure sample can still contain much less peptide than its powder weight.
The impurity peaks are usually broken or altered versions of the peptide. Their effects in the body are generally unknown.
High purity says nothing about the amount. A vial can be 99% pure and still hold half the labelled milligrams.
Quantity: is the amount right?
Quantity, sometimes called content or assay, is how many milligrams of peptide the vial actually holds. Compare it with the label: 9.86 mg in a vial labelled 10 mg is 98.6% of the label claim. Licensed medicines are typically held to roughly 90–110% of the label; grey-market products have no required range.
How the lab measures it
Quantity is normally measured by HPLC against a reference standard: a sample of the same peptide whose amount and purity are already known.
Dissolve the whole vial
The lab dissolves the contents in an exact volume of liquid.
Run the reference standard
Known amounts of the standard are run first, usually at several concentrations, to see how big a peak each amount produces. This is the calibration.
Run your sample
The sample is run under the same conditions. Its main peak should appear at the same retention time as the standard's.
Compare peak sizes
The size of the sample's peak, read against the calibration, gives the concentration. Multiplied by the volume, that is the milligrams in your vial.
Illustration, not a real result. The sample's main peak should sit at the same time as the standard's, and its size, compared with the standard, gives the amount.
Purity is not quantity. Purity compares peaks within your sample. Quantity needs a comparison with a standard. A report that works out milligrams from purity alone hasn't really measured quantity.
The standard sets the accuracy. For semaglutide and tirzepatide, reference standards are available. For retatrutide, an unapproved drug, labs rely on commercial or in-house standards, so quantity results carry more uncertainty.
Small differences are normal. Results vary by a few percent between runs and labs. 9.6 mg against a 10 mg label is not a meaningful shortfall; 6 mg is.
Check the units. Is the result per vial or per milligram of powder? Does the label mean the peptide itself or the total powder? Either can change the answer a lot.
What a good chromatogram shows
Look for
Why it matters
Sample name or report number printed on the chromatogram
Ties the picture to your report, not someone else's.
A time axis and signal axis with units
Lets you see where peaks fall and compare with other reports.
One sharp, symmetrical main peak
A clean sample. A broad, split or shouldered peak can hide another substance.
The main peak's retention time, matching the standard's
Supports that the main peak is the right peptide.
A flat baseline, shown in full from start to end
A cropped picture can hide extra peaks.
A peak table: retention time, area and area % for each peak
Shows how the purity figure was calculated.
Is the reference standard's chromatogram included?
Often not. Many lab reports for consumers show only the sample's chromatogram and the final numbers. The lab keeps the standard's data and calibration in its own records.
That isn't a problem in itself, but it means you can't check two things yourself: that your main peak matches the standard's retention time, and that the quantity was calibrated against a real standard of the same peptide. If it matters, ask the lab:
Which reference standard was used: its source, lot and purity.
Whether it is the same peptide as your sample.
How many calibration points were run.
Whether they can send the standard's chromatogram.
A lab that reports milligrams but can't name the standard it used has given you an estimate, not a measurement.
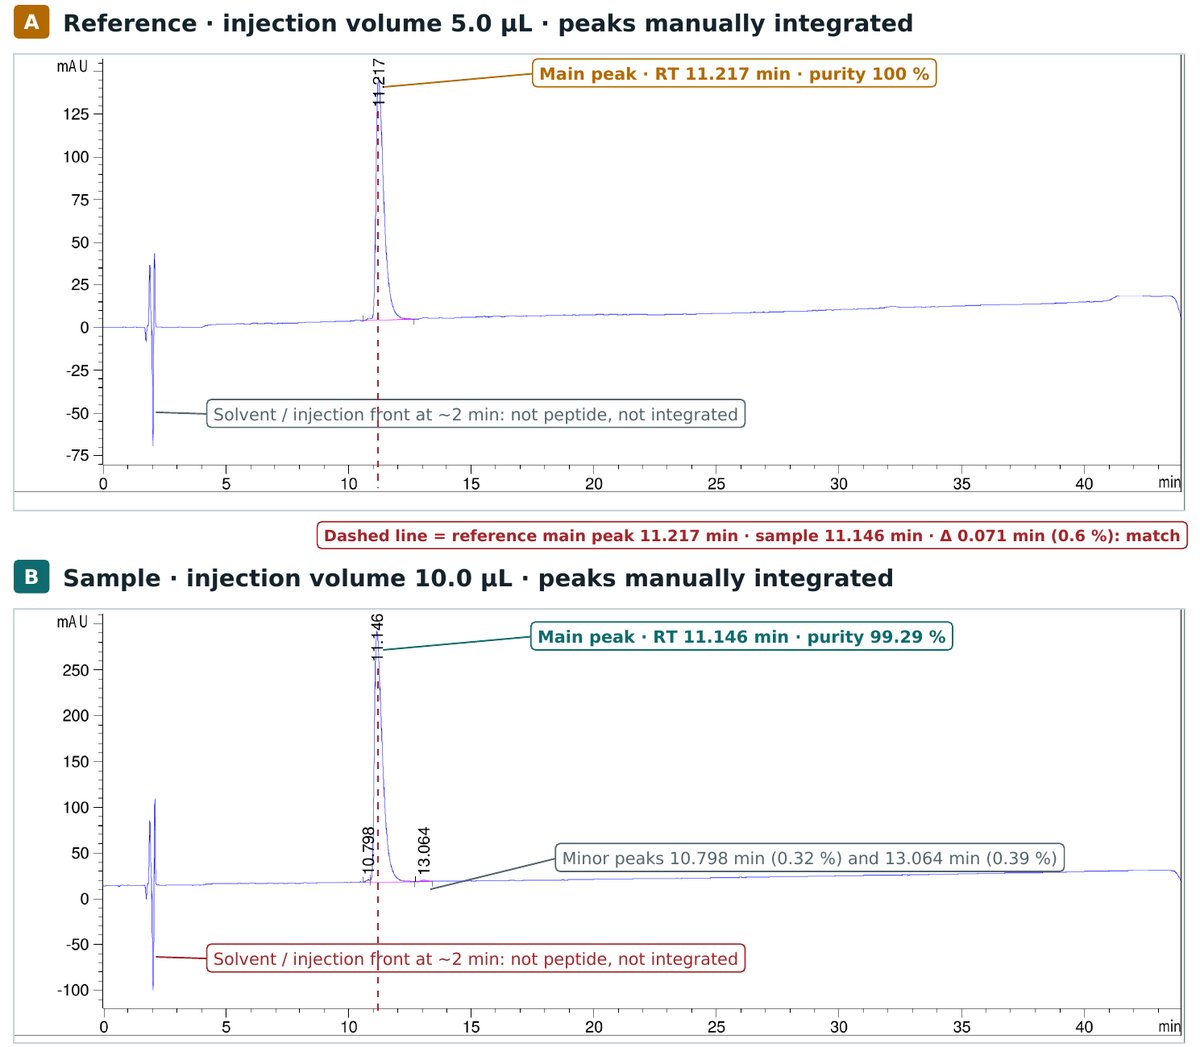
A real HPLC example: reference standard vs sample
Below are two real HPLC runs on the same instrument with the same method: a reference standard and a sample of the same peptide. Names, file paths and dates are removed; the peptide is not a GLP-1, but the reading is the same for any peptide. Detection is UV at 220 nm on a C18 column, over a 40-minute gradient.
Real data, annotated. The dashed line marks the reference's main peak. The spikes at about 2 minutes in both runs are the solvent / injection front, not peptide, so they are left out of the purity calculation.
Reference · 5.0 µL injected
Peak
Time (min)
Area (mAU·s)
Area %
1
11.217
3171.92
100.00
Sample · 10.0 µL injected
Peak
Time (min)
Area (mAU·s)
Area %
1
10.798
20.36
0.32
2
11.146
6273.65
99.29
3
13.064
24.75
0.39
What the two runs tell you
Reference
Sample
What it means
Main peak time
11.217 min
11.146 min
0.071 min apart (0.6 %): inside accepted tolerance
Purity
100 %
99.29 %
Two small impurities either side of the sample's main peak
Injected volume
5.0 µL
10.0 µL
Sample injected at twice the volume, so its peak is about twice as tall
Area per µL injected
634.4
627.4
Sample concentration is 98.9 % of the reference's
Amount: peak area divided by the injected volume puts both runs on the same scale. The sample gives 98.9 % of the reference's signal per µL, so if the reference concentration is known, the sample's concentration is 98.9 % of it.
Purity: both runs are integrated the same way, with the solvent front excluded. Integration rules matter: when the same reference was integrated with the solvent front included, the software reported 74.7 % instead of 100 %. Always check that every run was integrated by the same rules.
How far apart can retention times be?
Retention time always moves a little between runs: with the mobile phase, column temperature, column age, flow rate and the injected volume. Published identity criteria for LC methods set these limits:
Criterion
Limit
This example
Sample vs standard retention time (SANCO guidance)
± 0.2 min
0.071 min: within
Relative retention time vs an internal standard (Decision 2002/657/EC)
± 2.5 %
No internal standard used
Relative retention time (Implementing Regulation (EU) 2021/808)
± 1 %
0.6 %: within
Peak retained at least twice the dead time (k ≥ 1)
k ≥ 1
11.2 min vs ~2 min front: met
Peak shape matches the standard's
Same shape
Both sharp and symmetrical: met
A match is necessary, but it isn't proof
If the retention time and peak shape match, the right peptide may be present, but more confirmation is needed. If they don't match, the peak can't be that peptide. Retention time can rule a compound out; it can't rule it in.
Why a different peptide can land in the same spot
HPLC separates by how water-repellent a molecule is, not by its sequence. Anything with similar behaviour on the column comes out at the same time. The ± 0.2 min window here is only about 1.2 peak widths wide, and many different molecules can fit inside it.
The UV detector sees every peptide. At 220 nm it mostly detects peptide bonds, so it can't tell which peptide made the peak.
Near-copies behave almost the same. A peptide with one amino acid missing, added or chemically changed closely resembles the original in weight, charge and behaviour on the column, and some co-elute with the main peak on a standard C18 column.
Some look-alikes even weigh the same. A version with one amino acid in its mirror-image (D-) form has exactly the same mass and often comes out at the same time, so even standard LC-MS can miss it.
One peak can hide two compounds. A clean-looking UV peak can contain more than one substance, so a high purity figure doesn't prove the peak is a single compound.
How an HPLC-only identity check can be fooled
Each of these passes a report that shows only retention time and purity. Knowing them tells you what to ask for.
What's in the vial
Why HPLC alone passes it
What catches it
A cheaper peptide with similar column behaviour
Comes out inside the retention-time window as one clean peak
Mass by LC-MS; co-injection with a certified standard
A crude or wrong-sequence version of the right peptide
Near-copies come out at almost the same time, or together
High-resolution MS, MS/MS sequencing, a second column of different type
A blend of the right peptide and a cheaper filler peptide
Both merge into one peak, and purity stays high
Mass spectrum across the peak; a second column
Anything, compared with a "reference" that isn't independent
A sample always matches its reference if they are the same material
A reference standard from an independent, certified source, with its own lot number
Peaks left out of the calculation
Peaks that aren't integrated don't appear in the purity figure
The full chromatogram and peak table; the same integration rules for every run
A different drug altogether in the right packaging
Retention time and purity alone don't name the molecule
LC-MS: in Germany, high-resolution LC-MS and NMR showed that fake GLP-1 pens contained an insulin instead
What does confirm identity
Mass by LC-MS: the measured mass within about 1 dalton of the expected value; high-resolution instruments narrow this to a few parts per million. See the identity section above.
Co-injection: sample and standard mixed 1:1 and run together must give a single peak. Two peaks, or a shoulder, means they are different.
A second, different column: a column of another chemistry or pH separates look-alikes that come out together on C18.
Sequence and mirror-image checks: MS/MS or peptide mapping, and chiral amino-acid analysis.
Verdict for this example: the retention times match within every tolerance above and the peak shapes match. That is consistent with the same peptide but does not confirm it: no co-injection was run and no mass spectrum is included. To confirm identity, add an LC-MS mass result and a co-injection with a certified reference standard.
Endotoxin is a toxin from bacterial cell walls that can cause fever and serious reactions when injected. It is measured with the LAL test in endotoxin units (EU), per milligram or per vial. Lower is better; the lab should state the limit it compares against. Filtering a mixed solution removes bacteria but not endotoxin.
Sterility is reported as pass or fail. A culture test takes about two weeks. Faster tests detect bacterial DNA instead. A pass on the tested sample can't guarantee every vial in the batch is sterile.
Reading example results
Label
Identity (LC-MS)
Purity
Quantity
What it means
Tirzepatide 10 mg
Molecular weight of tirzepatide: 4813.5 DaFound in vial: 4813.4 Da→ Confirmed: tirzepatide
99.2%
9.86 mg
Matches label Right molecule, clean, right amount.
Tirzepatide 10 mg
Molecular weight of tirzepatide: 4813.5 DaFound in vial: 4813.6 Da→ Confirmed: tirzepatide
98.7%
6.10 mg
Underdosed 61% of the label. Every measured dose is too low.
Semaglutide 5 mg
Molecular weight of semaglutide: 4113.6 DaFound in vial: 4113.5 Da→ Confirmed: semaglutide
82.4%
4.90 mg
Impure Right molecule, but almost a fifth is something else.
Tirzepatide 10 mg
Molecular weight of tirzepatide: 4813.5 DaFound in vial: 4113.6 Da→ Not confirmed: the mass matches semaglutide (4113.6 Da)
98.9%
—
Wrong molecule Sold as tirzepatide, but it is semaglutide. Every dose is a different drug at a different strength.
Retatrutide 10 mg
Molecular weight of retatrutide: 4731.4 DaFound in vial: no peptide signal→ Not confirmed: no peptide detected
—
0 mg
No peptide The vial doesn't contain what it claims.
Example results for illustration, not real reports. A found mass within about 1–2 Da of the expected value counts as a match. When it doesn't match, compare it with the other GLP-1 masses in the identity table above: a fake can contain a different peptide altogether.
Results apply to the sample tested
A good result covers that one vial, on that day. A new batch needs a new test. If your result shows a problem, see what to do next. This page is for education, not medical advice.